
Flot

Limitations: lines, points, filled areas, bars and combinations of these
From an interaction perspective, Flot by far will get you as close as possible to Flash graphing as you can get with jQuery. Whilst the graph output is pretty slick, and great looking, you can also interact with data points. What I mean by this is you can have the ability to hover over a data point and get visual feedback on the value of that point in the graph.

On top of this, you also have the ability to select a chunk of the graph to get data back for a particular “zone”. As a secondary feature to this “zoning”, you can also select an area on a graph and zoom in to see the data points a little more closely. Very cool.
Sparklines

Limitations: Pie, Line, Bar, Combination
Sparklines is my favourite mini graphing tool out there. Really great for dashboard style graphs (think Google Analytics dashboard next time you login). Because they’re so tiny, they can be included in line (as in the example above). Another nice idea which can be used in all graphing plugins is the self-refresh capabilities. Their Mouse-Speed demo shows you the power of live charting at its best.
Google Charts Plugin

Limitations: Bar, Stacked, Line, Pie, Pie 3D
The Google Charts plugin is a really easy way to implement the Google Charts API into your web application using a jQuery plugin. Whilst the API itself is pretty simple to use (the format to generate graphs is to form a complex url with multiple query string parameters), the plugin goes one step further and actually forms that complex url for you, by allowing you to set the parameters you want with simple jQuery calls:
|
jQuery Chart 0.21

Limitations: Area, Line, Bar and combinations of these
jQuery Chart 0.21 isn’t the nicest looking charting plugin out there it has to be said. It’s pretty basic in functionality when it comes to the charts it can handle, however it can be flexible if you can put in some time and effort into it.
jQchart

Limitations: Bar, Line
jQchart is an odd one, they’ve built in animation transistions and drag/drop functionality into the chart, however it’s a little clunky – and seemingly pointless. It does generate nice looking charts if you get the CSS setup right, but there are better out there.
TufteGraph

Limitations: Bar and Stacked Bar
Tuftegraph sells itself as “pretty bar graphs that you would show your mother”. It comes close, Flot is prettier, but Tufte does lend itself to be very lightweight. Although with that comes restrictions – there are few options to choose from, so you get what you’re given. Check it out for a quick win bar chart.
jQuery Visualize Plugin
jQuery Visualize Plugin is the perfect plugin if you have a table and want to generate a chart out of it. It offers different types of charts such as Bar, Area, Pie & Line charts.
Examples

Type of Charts: Bar, Area, Pie & Line.
Requirements: jQuery, excanvas (included)
Browser Support: IE6*, IE7*, IE8*, Firefox 2, Firefox 3.5, Safari 3 and 4, Opera 9.
* HTML 5 canvas element is not supported by IE but Google maintains a library that translates canvas scripting into VML, allowing it to work in all versions of internet explorer.
Demo: http://www.filamentgroup.com/examples/charting_v2/index_2.php
License: MIT and GPL licenses
Highcharts
Highcharts is a really impressive jQuery Chart Library. In a few words Highcharts is compatible with most Browsers and even the iPhone; numerous chart types are supported; it is a dynamic plugin because you can add, remove and modify series, axes or points at any time after chart creation and you can load data from external files; tooltip labels are also supported which is great for detailed information in a point of a chart; zooming and last but not least all text labels can be rotated in any angle.Examples

Line and column example

Columns with rotated labels
Requirements: jQuery or MooTools
Browser Support: IE6, IE7, IE8, Firefox 2, Firefox 3.5, Safari 3 and 4, Opera 9 and iPhone!
Demo: http://www.highcharts.com/demo/
License: Creative Commons Attribution Non-Commercial 3.0 License. Free for personal website, a school site or a non-profit organization. For a single commercial Website the license costs $80.
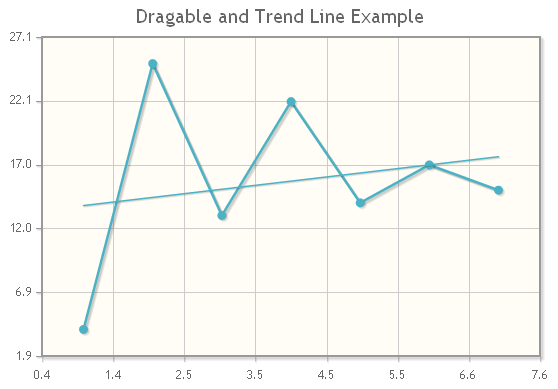
jqPlot
jqPlot did not catch my eye at first glance but after further research I found it to be one of the best and free jQuery chart library. Numerous graphical options are available you can even add shadows and interact per drag&drop in the charts! It even automatically computes trend lines. We could compare it to highcharts in terms of features and functionality.Examples

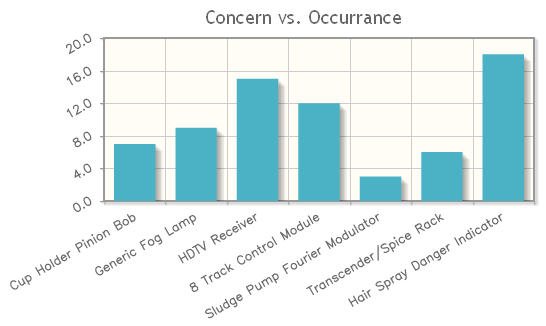
Type of Charts: Bar, Pie & Line.
Requirements: jQuery
Browser Support: IE6, IE7, IE8, Firefox 2, Firefox 3.5, Safari 3 and 4, Opera 9 and Google Chrome.
Demo: http://www.jqplot.com/tests/
License: MIT and GPL version 2 licenses
No comments:
Post a Comment